_chart.barLine
(Merge only)
This method draws a bar chart with overlaid line graphs.
Syntax
_chart.barLine(data [, options])
Parameters
data is a script array of data points to be charted. See _chart Data for formatting details. options is a script object whose properties define various presentation options. See the _chart Display Options for details.
Returned Value
True if successful, false if an error occurred.
Description
The data array contains a list of data sets to be drawn on the chart. The first data set (column) is drawn as a series of vertical bars. All other data columns create line charts that overlay these bars. See _chart.hBar and _chart.line for details on their construction and options. The _chart.barLine() routine must be called from a "containing" object, typically a Group object. The chart is drawn within this object. Bar widths, scaling etc. are all automatically calculated so that the chart fills the containing object. See the _chart Display Options for details on how to modify colors, legends, fonts, etc.
Example
options = {
	MarkerStyle: ['none']
};

var data = [
['Month', 'Electricity (kWh)', 'Last Year', 'Average']
, ['SEP', 440, 420]
, ['OCT*', 421, 430]
, ['NOV', 469, 445]
, ['DEC*', 460, 440]
, ['JAN', 386, 430]
, ['FEB*', 423, 425] ];

var avg = 0;
for (i=1; i<data.length; i++) {
	avg += data[i][1];
}

avg = avg/(data.length-1);

for (i=1; i < data.length; i++) {
	data[i][3] = avg;
}

_chart.barLine(data, options);
Results in:
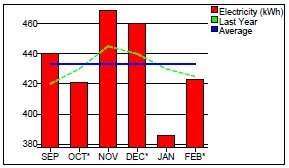
This chart shows a set of bars representing monthly electricity usage. The previous year's data is shown as a green line. The blue "Average" line is computed and added using a script. Colors, fonts, and other options are controlled by the options parameter. See _chart Display Options for details.