_chart Data
The _chart routines all use a common method of passing data to the various routines. Data is passed to the charting routines as a JavaScript array of data sets. For example:
var data = [
  ['Year', 'Estimate', 'Actual']
   , [2001, 1.5, 2]
   , [2002, 10, 11]
   , [2003, 1, 5]
   , [2004, 1.5, 2]
   , [2005, 10, 11]
   , [2006, 1, 5] ];
In the above example, the variable 'data' has been assigned a series of 6 data sets (rows) plus a header row. Each data set is itself an array of names and/or values. The first row is a header. It must have the same number of array elements as each of the following data rows. This header row lists the names to be given to each column of data - in this case the first column is a 'Year', the second is called 'Estimate', and third is 'Actual'. These names may be used when labeling legend data. The values in the first column are the "primary data" values. These are considered to be the name of the row and can be either a number or a string (2001 and '2001' mean the same thing). All other data should be numeric.
For a simple bar chart with vertical bars the primary data represents the values along the bottom X-axis of the chart. The second and successive columns represent the Y-axis height of the bars. A rotated bar chart (vBar) would display the primary data along the vertical (left) side of the chart, with bars extending horizontally. In a pie chart the primary data is the name of each pie slice and the second column value represents the slice size. The primary data values (2001, 2002, etc.) are used as labels for the primary axis of bar charts and line graphs. They can also be used to label individual slices of a pie chart. Bar charts and line graphs allow multiple data columns (columns 2 and up). They produce sets of bars or multiple overlapping lines. Pie charts only take a single data column.
Charting data should always be positive values.
Creating Data
The simplest way to provide data is by directly creating a JavaScript array in the appropriate structure (see above). Data can also be extracted from a Merge document's data stream and loaded into an appropriate data array. This can be done using the _data._loadAsArray() function - see the _data functions. For example, consider an XML data file with the following data somewhere within it:
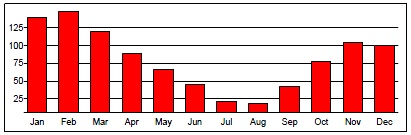
<usageHistory>
         <period>
             <month>Month</month>
             <usage>Usage</usage>
         </period>
         <period>
             <month>Jan</month>
             <usage>139</usage>
         </period>
         <period>
             <month>Feb</month>
             <usage>148</usage>
         </period>
         <period>
             <month>Mar</month>
             <usage>119</usage>
         </period>
         ...
</usageHistory>
The following script could be used to load that data and display a bar chart of the data:
data = _data._loadAsArray("usageHistory");
_chart.vBar(data);
Resulting in:
In this example there is an entry with the data name information. i.e.
<period>
	<month>Month</month>
	<usage>Usage</usage>
</period>
Quite often that leading entry is not provided. You can handle that by providing the first set of "name" data right in the _loadAsArray function call. In this example you would use:
data = _data._loadAsArray("usageHistory", ["Month", "Usage"]);
_chart.vBar(data);
The optional second argument to _loadAsArray is an array giving the names of the data being loaded. It must have the same number of elements as is in the loaded data.
(Before 3.1.001.08) You could use the second argument but you may as well supply simply [] (an empty array), and following the _loadAsArray call, do an explicit set of the [0] element. Per this example,
 data = _data._loadAsArray("usageHistory", []);   // pre 3.1.001.08 workaround
 data[0] = ["Month", "Usage"];                    // set the real [0] entry.
 _chart.vBar(data);
By using the second argument, room was provided in the array for the [0] element, but it was not loaded properly. Fixed in 3.1.001.08.