_chart Margins and Spacing
The spacing of various objects within a chart can be modified by using a variety of settings. For example, consider this basic bar chart:
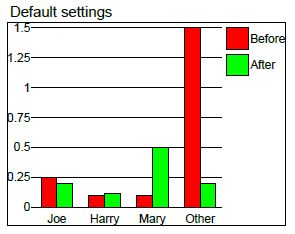
This chart uses the default setting for charts and is displayed inside a default Group object whose margins are 0.
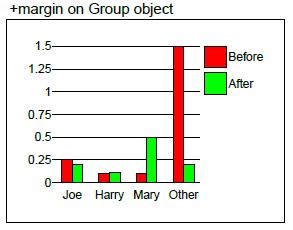
Group Object Margins
By introducing a margin setting on the object (typically a Group) that contains the chart, you can change the amount of space between the borders of the group and the drawing. Of course, each margin can be set individually.
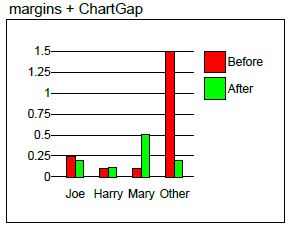
ChartGap settings
The ChartGap (or individual ChartGapTop, ChartGapLeft, etc.) settings define a bit of space between the actual chart and the surrounding captions and legends. Note for instance how the legend is separated from the chart grid. Also the captions at the bottom are a bit further down, and the left captions are a bit further away from the actual bars. This of course shrinks the bars slightly in order for it all to appear inside the fixed containing Group. The default ChartGap is 0.05".
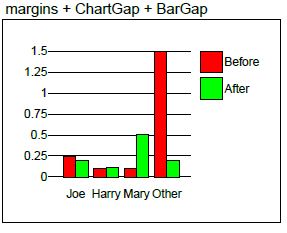
BarGap setting
The BarGap setting changes the amount of space allotted between each set of bars and the ones next to them. The gap gets smaller, and the bars themselves get slightly wider. The default BarGap is 0.15".
LegendGap setting
The LegendGap is the space between the two colored legend rectangles. The default LegendGap is 0.05".
