_chart.line
(Merge only)
This method draws a horizontal line graph.
Syntax
_chart.line(data[, options])
Parameters
data is a script array of data points to be charted. See _chart Data for formatting details. options is a script object whose properties define various presentation options. See the _chart Display Options for details.
Returned Value
true if successful, false if an error occurred.
Description
The data array contains a list of data sets to be drawn as overlapping horizontal line graphs. The _chart.line() routine must be called from a containing object, typically a Group object. The chart is drawn within this object. Lines are drawn horizontally from the left to right on the chart. Data is provided as a series of primary (X-axis) data sets, each with one or more data values (Y-axis). Each X-axis data set creates a single connected line graph. See the _chart Display Options for details on how to modify colors, legends, fonts, etc.
Example
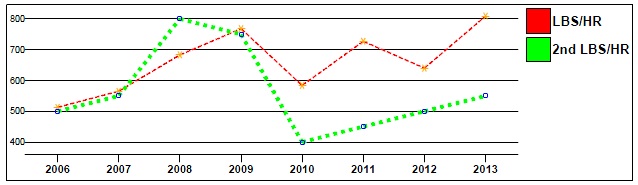
var data = [['Date', 'LBS/HR', '2nd LBS/HR']
, [2006, 513, 500]
, [2007, 565, 550]
, [2008, 683, 800]
, [2009, 768, 750]
, [2010, 584, 400]
, [2011, 727, 450]
, [2012, 640, 500]
, [2013, 809, 550] ];
options = {
	chartgap:100000
	, LegendFont:{Size:12, Bold:true}
	, XFont: {Size:10, Bold:true}
	, LineThickness: [20000, 50000]
	, LineStyle: ['Dash', 'Dot']
	, MarkerStyle: ['star', 'openbox']
	, MarkerColor: ['orange', 'blue']
	, Markersize: [100000, 50000]
	, ValueFont :{Size:10, Bold:true }
};
_chart.line(data, options);
Results in: