_chart.hBar
(Merge only)
This method draws a bar chart with a series of horizontal bars.
Syntax
_chart.hBar(data [, options])
Parameters
data is a script array of data points to be charted. See _chart Data for formatting details. options is a script object whose properties define various presentation options. See the _chart Display Options for details.
Returned Value
true if successful, false if an error occurred.
Description
The data array contains a list of data sets to be drawn on the chart. The first data set (column) is drawn as a series of vertical bars. All other data columns create line charts that overlay these bars. See _chart.hBar and _chart.line for details on their construction and options. The _chart.barLine() routine must be called from a parent object, typically the Group object. The chart is drawn within this object. Bar widths, scaling, etc., are all automatically calculated so that the chart completely fills the container object. See the _chart Display Options for details on how to modify colors, legends, fonts, etc.
Example
options = {
	MarkerStyle: ['none']
};

var data = [
['Month', 'Electricity (kWh)', 'Last Year', 'Average']
, ['SEP', 440, 420]
, ['OCT*', 421, 430]
, ['NOV', 469, 445]
, ['DEC*', 460, 440]
, ['JAN', 386, 430]
, ['FEB*', 423, 425] ];

var avg = 0;
for (i=1; i<data.length; i++) {
	avg += data[i][1];
}

avg = avg/(data.length-1);

for (i=1; i < data.length; i++) {
	data[i][3] = avg;
}

_chart.barLine(data, options);
Results in:
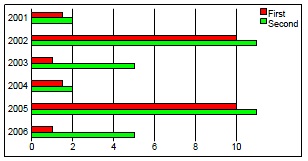
This chart shows the use of two parallel sets of bars for each Y-axis data point. Colors, fonts, and other options are controlled by the options parameter.
See _chart Display Options for details.