_chart.pie
This method draws a piechart for a set of data.
Syntax
_chart.pie(data[, options])
Parameters
data is a script array of data values to be charted. See _chart Data for formatting details. Unlike bar charts, the pie chart can contain only a single set of data. These values must all be positive values. options is a script object whose properties define various presentation options. See the _chart Display Options for details.
Returned Value
true if successful, false if an error occurred.
Description
The data array contains a list of data sets to be drawn on the pie chart. The _chart.pie() routine must be called from a containing object, typically a Group object. The chart is drawn within this object. Bar widths, scaling, etc. are all automatically calculated so that the chart completely fills the container object. Each data element consists of a Name and a data Value. The pie chart represents the proportion or percentage of the total of all Values that each element represents. Each pie "slice" can be color-coded or distinctly shaded. Selected slices can also be "featured", causing them to be offset from the center of the chart to accentuate them. Data is provided as a series of primary (Y-axis) data sets, each with one or more data values (X-axis). See the _chart Display Options for details on how to modify colors, legends, fonts, etc.
Pie charts can be made "3D" by setting the Y3D option which adds depth to the chart. It is suggested that PieRound also be set to false which creates an oval pie chart.
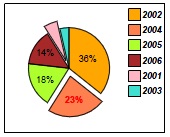
Example
var data = [['Year', 'Data']
, [2001, 1.5]
, [2002, 10]
, [2003, 1]
, [2004, 6.5]
, [2005, 5]
, [2006, 4] ];

var options = {
	chartgap:250000,
	colors:['orange', 'coral', 'greenyellow', 'brown', 'lightpink', 'turquoise'],
	legendfont:{bold:true, italic:true},
	sort:true,
	valueformat:'[percent]',
	feature:['2002', '2005'], pieoffset:'2mm',
	featurefont:{bold:true, color:'red'}
};

_chart.pie(data, options);
Results in: