_chart.vBar
This method draws a barchart with a series of vertical bars.
Syntax
_chart.vBar(data[, options])
Parameters
data is a script array of data points to be charted. See _chart Data for formatting details. options is a script object whose properties define various presentation options. See the _chart Display Options for details.
Returned Value
true if successful, false if an error occurred.
Description
The data array contains a list of data sets to be drawn on the bar chart. The _chart.vBar() routine must be called from a containing object, typically a Group object. The chart is drawn within this object. Bar widths, scaling etc. are all automatically calculated so that the chart fills the container object. Bars are drawn vertically. Data is provided as a series of primary (X-axis) data sets, each with one or more data values (Y-axis). Each X-axis data set creates a cluster of one or more vertical bars for that primary value. See the _chart Display Options for details on how to modify colors, legends, fonts, etc.
Example
var data = [['Year', 'First', 'Second']
, [2001, 1.5, 2]
, [2002, 10, 11]
, [2003, 1, 5]
, [2004, 1.5, 2]
, [2005, 10, 11]
, [2006, 1, 5] ];

_chart.vBar(data);
Results in:
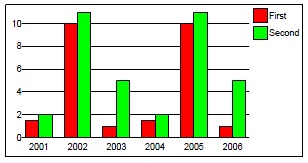
This chart shows the use of two parallel sets of bars for each X-axis data point. Colors, fonts, and other options are controlled by the options parameter.