_chart (Draw Bar Charts and Pie Charts)
(Merge only)
Description
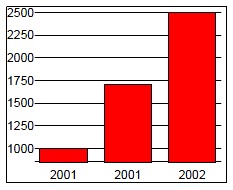
Merge enables you to create bar charts, pie charts, and line graphs and embed them into the documents. The data can be embedded in the XML data stream or created dynamically using JavaScript. The charts are created using the _chart JavaScript routines within Merge. The _chart routines draw within the area of (typically) a Group object in Design. The Group object defines the physical size and position of the chart. The chart is automatically scaled to fit within the margins of the Group. A simple chart description might be coded as follows:
var data = [['Year', 'Sales'], [2001, 1000], [2001, 1700], [2002, 2500]];
_chart.vBar(data, null);
Resulting in:
Usage
All charts are generated within Merge. They use standard Merge objects including fonts and various filled objects. They are NOT raster images.
Charts are created by calling one of the _chart methods listed below. Each takes a data parameter (see _chart Data) and a formatting options parameter (see _chart Display Options). The data is either generated by your javascript program or by reading from an external file or by loading from the Merge data stream.
Functions
_chart.barLine(data [, options]) | Draw a bar chart using vertical bars for 1st data set and line graphs for all other data sets. A combination of _chart.vBar() and _chart.line() functionality. |
_chart.hBar(data [, options]) | Draw a bar chart with horizontal bars. |
_chart.line(data [, options]) | Draw a line graph. |
_chart.pie(data [, options]) | Draw a pie chart. |
_chart.vBar(data [, options]) | Draw a bar chart with vertical bars. |